A smaller click total does not identify the problem
Suppose a guide received 400 search clicks last month and 280 this month. That decline is real within the report, but the cause is still unknown. Fewer people may have searched for the topic. The page may have appeared less often. Its query mix may have shifted. People may have chosen other results more frequently. Treating all of those possibilities as “the title needs fixing” skips the diagnosis.
Start by separating exposure from choice. Impressions describe occasions when the site appeared according to the report’s counting rules. Click-through rate describes the share of recorded impressions that produced clicks. Average position provides another view, but it is an aggregate rather than a single stable rank. None of these measures is the same as a useful business or editorial outcome.
Google’s Search Console performance overview defines the available measures and dimensions. The workflow here uses them to narrow a practical question: what changed enough to explain the decline, and what evidence would justify a response?
Make the comparison fair before interpreting it
Check the time ranges first. Compare equal-length periods with a similar mix of weekdays. Avoid treating a partial current month as a full month. Note holidays, seasonal topics and major publication changes. If the newest data is preliminary, say so in your notes and revisit it before making a costly decision.
Keep the same search type and filters. A comparison between one period filtered to mobile and another containing all devices cannot answer a clean question about overall change. Write down the configuration so a colleague can reproduce it. The useful record is not simply a screenshot; it is the page or query selection, dates, dimensions and filters.
For seasonal content, an adjacent-period comparison may be misleading. A guide to end-of-year reporting can naturally lose interest after the reporting season. Where adequate data exists, compare the same period in a previous year as an additional view. This does not prove seasonality, but it helps test whether the pattern is recurring rather than entirely new.
Use a decomposition instead of a headline percentage
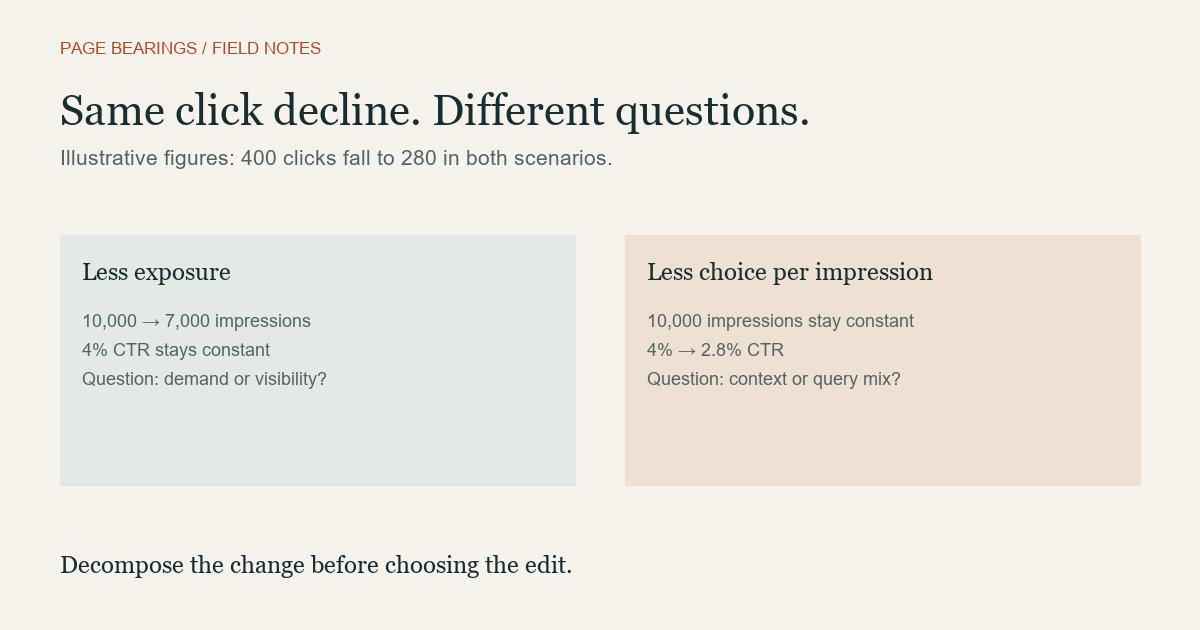
Consider an illustrative page with 10,000 impressions and a 4 percent click-through rate. It receives 400 clicks. In the next period, 7,000 impressions at the same rate produce 280 clicks. Exposure fell, while the recorded choice rate stayed the same. A title rewrite is not the most direct response to that evidence.
Now change the example: impressions remain at 10,000, but the rate falls to 2.8 percent. The click total is again 280. This time, the page had similar recorded exposure and fewer clicks per impression. You should inspect query mix, device mix, search appearance and the page’s promise before deciding whether the title is the issue.
| Illustrative change | First question |
|---|---|
| Impressions down, CTR stable | Did demand, visibility or query coverage change? |
| Impressions stable, CTR down | Did the result context or query mix change? |
| Clicks stable, outcomes down | Did the landing page or outcome measurement change? |
| All measures shift across the site | Is there a site-wide technical or reporting change? |
These are diagnostic starting points. Several causes can occur together. The table deliberately does not turn a pattern into a guaranteed explanation. Its purpose is to prevent a broad click decline from triggering an unrelated edit.
Move from the site total to the affected group
List the pages responsible for most of the absolute click change. A site can lose many clicks because one large seasonal page changes, even if the rest of the publication is stable. A percentage decline on a tiny page can look dramatic while contributing little to the site-wide total.
Group the affected pages by topic, template and likely audience. If all the affected URLs share a template changed last week, inspect the public output. If they share a seasonal task, inspect demand context. If they cover unrelated topics but all use a particular URL pattern, check indexing and redirects. Follow the common feature that can explain the group.
For one important page, inspect query groups rather than only individual rows. Distinguish queries that seek the exact brand, queries about the page’s main task and queries about a secondary topic. A shift toward broad exploratory queries can alter the aggregate rate even when the page performs similarly for its intended audience. Keep the group definitions explicit so the analysis can be repeated.
Inspect the page and the result promise
Open the affected page anonymously. Confirm that it loads, presents the correct content and offers the next step the reader expects. Check whether a redesign moved the useful answer below a large introduction. Check the canonical and robots directives if a template or plugin changed. Our URL controls guide explains what those settings mean.
Then inspect how the page describes itself. Is the title still accurate? Does the opening fulfill it? A title that promises a current checklist while the body contains obsolete steps has a content problem as well as a presentation problem. Rewriting the title alone may make the promise more attractive without fixing the disappointment.
Google’s title-link documentation explains that search result titles may be generated from several page signals. Your HTML title is a useful input, not a guarantee of the exact text shown. Record what you observed in the result context instead of assuming the dashboard title is the delivered title.
Choose one response and name the uncertainty
If the evidence points to a broken public page, repair that first. If it points to an outdated answer, write a revision brief. If it points to a different query mix, consider whether the page still serves the intended task before trying to capture every new query. Some changes require observation rather than immediate intervention.
Document a short hypothesis: “This guide lost exposure for migration-planning queries after its URL changed; we will verify redirects and canonical consistency.” Include the action, the expected signal and the next review point. Do not claim that later improvement proves the action caused it; other conditions may have changed at the same time.
Finally, compare search traffic with the outcome the page serves. A smaller audience completing more useful tasks may be preferable to a larger audience arriving for the wrong reason. Our measurement plan helps define those outcomes. The diagnostic goal is a defensible next decision, not a story that explains every movement in a chart.